Important Questions Class 9 Maths Chapter 14
Important Questions Class 9 Mathematics Chapter 14 - Statistics
Chapter 14 of Class 9 Mathematics introduces students to Statistics.
Statistics is a study dealing with data collection, presentation, interpretation, and analysis.
Below are some of the topics covered in this chapter.
Data
- Truths /figures, numerical or otherwise, collected for a definite purpose are called data.
- Primary data: data gathered first-hand data
- Secondary data: Data accumulated from a source that already had data reserved
Frequency: The number of times a respective instance occurs is called frequency in statistics.
Ungrouped data: Ungrouped data is the given data in its original or raw form. The observations are not classified.
Grouped data: In grouped data, statements are organised in groups.
Class interval
- The required size of the class into which a particular data is divided.
- E.g. divisions on a histogram or bar graph.
- Class width = upper-class limit – lower-class limit.
Regular and irregular class interval
- Regular class interval: When the class intervals are equal or of the same sizes.
- E.g 0-10, 10-20, 20-30….. 90-100
- Irregular class interval: When the class intervals are of varying sizes.
- E.g 0-35, 35-45, 45-55, 55- 80, 80-90, 90-95, 95-100
Frequency table: A given frequency table or distribution shows the occurrence of a particular variable in a tabular form.
Sorting
- Raw data requires to be sorted to carry out operations.-
- Sorting ⇒ ascending order or descending order
Ungrouped Frequency Table: When the required frequency of every class interval is not arranged or organised.
Grouped Frequency Table: The required frequencies of the corresponding class intervals are organised or arranged in a particular manner, either ascending or descending.
Extramarks is one of the best online educational materials for students from grades 1 to 12. Our expert Mathematics subject experts have prepared exhaustive NCERT chapter-wise solutions to help students study and prepare for their various school and competitive exams. Students can also refer to our Important Questions Class 9 Mathematics Chapter 14 to practise exam-oriented questions. We have collected questions from various sources such as NCERT textbooks and exemplars, CBSE sample papers, CBSE past year question papers, etc. Students can prepare well for their exams and tests by solving different chapter questions from our Chapter 14 Class 9 Mathematics Important Questions.
Students are recommended to register on our website to get access to our question bank and its solutions. Apart from our Important Questions Class 9 Mathematics Chapter 14, students will find many other study materials on our website.
Important Questions Class 9 Mathematics Chapter 14 - With Solutions
At Extramarks, we highlight crucial concepts and questions from each chapter which help students with their studies right before their examinations. By solving the Important Questions Class 9 Mathematics Chapter 14, the students will be familiar with the questions expected in the final exams and the question paper pattern.
While solving important questions, students must understand every concept to answer any question easily. Our step-by-step solutions given for all questions in our Class 9 Mathematics Chapter 14 Important Questions helps students revise the chapter while solving the questions.
Given below are a few questions and their answers from our questionnaire of Important Questions Class 9 Mathematics Chapter 14:
Question 1: Provide three examples of data which you can obtain from your day-to-day life.
Answer 1: Here are the required three examples which are connected to our day-to-day life :
- The given number of boys in a sports team.
- Electricity bills for the previous year.
- The required number of students appearing for board exams in your school.
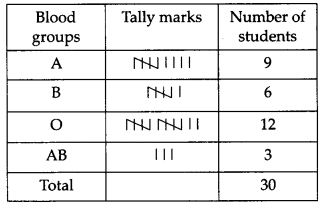
Question 2: The required blood groups of 30 students of class VIII are registered as follows.
A, B, O, O, AB, B, A, O, B, A, O, B, AB, O, O,
A, A, O, A, A, O, O, AB, O, A, O, B, A, B, O
Illustrate this data in the form of a given frequency distribution table. Which is the most familiar, and which is the rarest required blood group among these students?
Answer 2: The necessary frequency distribution table is
Image source: https://www.learncbse.in/wp-content/uploads/2020/10/NCERT-Solutions-for-Class-9-Maths-Chapter-14-Statistics-Ex-14.2-Q1.png
From the above table, we have The considerable common blood group O. The rarest blood group is AB.
Question 3: The class mark of class 90-120 is
(a) 90 (b) 105 (c) 115 (d) 120
Answer 3: (b) In a required class 90-120, upper class = 120
and lower class = 90
Class mark = upper class + lower class /2= 120 + 90/2 = 210/2 = 105
Question 4: In a given diagnostic test in mathematics given to students, the following marks (out of 100) are registered 46, 52, 48, 11, 41, 62, 54, 53, 96, 40, 98 and 44.
Which average will be a suitable representative of the above data and why?
Answer 4:The Median designates the middle value for any given group. It is the point at which half the data is more, and half the data is less.
The Median helps to represent many data points with a single data point. The median is the easiest statistical measure to calculate.
For the calculation of the median, the data has to be arranged in ascending order, and then the middlemost data point represents the median of the data.
An example is to figure out the median for a given data set.
Step I: Let us take the data: 4, 4, 6, 3, and 2. By arranging in ascending order: 2, 3, 4, 4, 6.
Step II: Counting the number of values, we know that there are five values.
Step III: The median value here is the median. Therefore, median = 4.
In this question, the median will be a good representative
- Each value occurs only once.
- Extreme values influence the data.
Therefore, the median will be a good representative of the above data
Question 5: The required number of family members in 10 flats of society are
2, 4, 3, 3, 1, 0, 2, 4, 1, 5.
Find the required mean number of family members per flat.
Answer 5: Number of family members in 10 flats -2, 4, 3, 3, 1, 0, 2, 4, 1, 5.
So, we obtain,
Mean = The sum of the given observation/ The total no of given observations
The required mean = (2 + 4+ 3 + 3 + 1 + 0 + 2 + 4 + 1 + 5) / 10
The required mean = 25/10
= 2.5
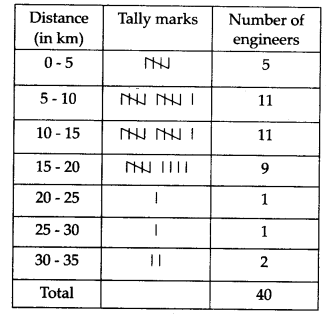
Question 6: The required distance (in km) of 40 engineers from their residence to their place of work was found as follows.
5 3 10 15 25 11 13 3 12 31
19 17 12 17 18 11 32 10 16 2
7 9 7 8 7 5 12 15 18 3
12 14 2 9 6 15 20 7 6 12
Create a grouped frequency distribution table with class size 5 for the data given above, bringing the first required interval as 0-5 (5 not included). What primary features do you observe from this tabular representation?
Answer 6: Since the provided data is extensive, we ought to group the data into category sizes of 5 individually and create a table that will create the essential features of the data visibly.
This table is comprehended as grouped frequency distribution table. The class intervals will be as follows 0-5, 5-10, 10-15, and so forth.
The distance in km of the given 40 engineers from their homes to their place of work can be illustrated as follows (with the help of tally marks)
Image source: https://www.learncbse.in/wp-content/uploads/2020/10/NCERT-Solutions-for-Class-9-Maths-Chapter-14-Statistics-Ex-14.2-Q2.1.png
The subsequent features can be observed from the above table.
- 5 Engineers have their homes below 5 km
- A majority of engineers (31) have their homes below 20 km
- Only a few engineers (4) have their homes at 20 km and above distance.
Question 7: In a frequency distribution, the mean value of a class is 10 and the width of the class is 6. The lower limit of the class
- is 6 (b) is 7 (c) is 8 (d) is 12
Answer 7: (b) Let x and y be the required upper and lower class limit in a frequency distribution.
Now, mean value of a class (x + y )/2=10 [given]
=> x + y = 20 …(i)
Also, given that, the required width of class x- y = 6 …(ii)
On adding Eqs. (i) and (ii), we get
2x =20+ 6
=> 2x =26 => x = 13
On placing x = 13 in Eq. (i), we get
13+y = 20=> y = 7
Therefore, the required lower limit of the class is 7.
Question 8: The required probability that bulbs selected randomly from the lot have a life of less than 900 h
(a) is 11/40 (b) is 5/16 (c) is 7/16 (d) is 9/16
Answer 8: (d) The required total number of bulbs in a lot, n(S) = 80
The required number of bulbs whose lifetime is less than 900 h, n(E) = 10 + 12 + 23 = 45
The required probability that the bulbs has lifetime less than 900 h =n(E)/n(S) = 45/80 = 9/16
Hence, the necessary probability that the bulb has a lifetime of less than 900 is 9/16.
Question 9: The given following list of the number of coupons printed in a required school canteen during a week as follows:
216, 322, 167, 105,273, 405 and 346.
Discover the required average no. of coupons allocated per day.
Answer 9: The number of coupons printed in a week: 105, 216, 322, 167, 273, 405 and 346.
So, we obtain,
Mean = The given sum of observation/The total no of required observations
Mean of the coupons = (106+ 215+ 323+166+273+405+346)/ 7 = 1834/7
Mean of the coupons = 262
Question 10: The required width of each of the five continuous classes in a frequency distribution is 5, and the required lower class limit of the lowest class is 10. The required upper-class limit of the highest class is
(a) 15 (b) 25 (c) 35 (d) 40
Answer 10: (c) Let x and y be the required upper and lower class limit of frequency distribution.
Given, The given width of the class = 5
=> x-y= 5 …(i)
Also, provided lower class (y) = 10 On placing y = 10 in Eq. (i), we obtain
x – 10= 5
x = 15
The required upper-class limit of the lowest class is 15.
Thus, the required upper-class limit of the highest class
=(The given number of continuous classes x The required Class width + The required lower class limit of the lowest class)
= 5 x 5+10 = 25+10=35
Therefore, the required upper-class limit of the highest class is 35.
Question 11: The required class marks of a continuous distribution are 1.04, 1.14, 1.24, 1.34, 1.44,1.54 and 1.64.
Is it right to say the last interval will be 1.55-1.73? Justify your answer.
Answer 11: It is not right. Because the given difference between two consecutive class marks should be equal to the class size, the required difference between the two consecutive marks is 0.1 and the class size of 1.55-1.73 is 0.18, which is not equal.
Question 12: A child states the median of 3, 14, 18, 20 and 5 is 18. What does the child not comprehend about seeing the median?
Answer 12: The child does not comprehend that data has to be arranged in ascending or descending order before seeing the median.
Question 13: If the required mean of six observations y, y + 1, y + 6, y + 8, y + 5 y + 4 is 13, find the value of y.
Answer 13: Mean = The sum of given observation/The total no of required observations
13 = (y + y + 1+ y + 6+ y + 8+ y + 5 + y + 4) / 6
13 = (6 x y + 24)/6
(13 x 6) = 6y +24
(13 x 6) – 24 = 6y
(13 x 6) – 6 x 4 = 6y
6(13 – 4) = 6y
y = 9
Question 14: If m is the required mid-point and l is the upper-class limit of a class in a continuous frequency distribution, then the lower-class limit of the given class
- is 2 m+l (b) is 2 m-l (c) is m-l (d) is m-2l
Answer 14: (b) Let x and y be the required lower and upper-class limits of a continuous frequency distribution.
Here, The given mid-point of a given class = (x + y)/2 = m [ is given]
x + y = 2 m =x + l = 2m
[∴ y = l = The given upper-class limit ]
x = 2 m-l
Therefore, the given lower class limit of the class is 2m – l.
Question 15: Shown are the scores (out of 25) of 9 students on a Monday's test :
14, 25, 17, 22, 20, 19, 10, 8 and 23
Discover the mean score and median scores of the data.
Answer 15: Given scores = 14, 25, 17, 22, 20, 19, 10, 8, 23
No. of scores = 9
Mean = Sum of Given Scores / No. of scores = (14+25+17+22+20+19+10+8+23)/9 = 158/9 = 17.55
The Median is the middle value. First, arrange the data in ascending or descending order to find the median. Here, I'll arrange the data in ascending order.
8, 10, 14, 17, 19, 20, 22, 23, 25
No. of terms (n) = 9
This means that n is odd. If n is odd, then median = (n+1)/2 th term = (9+1)/2 th term = 10/2 th term = 5 th term = 19.
Hence 19 is the median.
Question 16: The required scores of an English test out of 100 of 20 students are given below:
75, 69, 88, 90, 55, 95, 88, 73, 64, 75, 98, 88, 95, 95, 88, 44, 59, 67, 88, 99.
See the median and mode of the data.
Answer 16: Ascending order of given data is as given below :
44, 55, 59, 64, 67, 69, 73, 75, 75, 88, 88, 88, 88, 88, 90, 95, 95, 95, 98, 99
Median = Mean of (n / 2)th and (n / 2 + 1)th
= Mean of (20 / 2)th and (20 / 2 + 1)th
= Mean of (10)th and (11)th observation
Mean of 88 and 88
= 88 marks
Since the frequency of 88 marks is the maximum, That is 5
Question 17:The required mean weight of a class of 34 students is 46.5 kg. If the required weight of the new boy is included, the mean rises by 500 g. Find the weight of the new boy.
Answer 17: The mean weight of 34 students = 46.5
The sum of the given weight of 34 students = (46.5 * 34) = 1581
Changing or increasing in the mean weight when the weight of a new boy is added = 0.5
The given new mean = (46.5 +0.5) = 47
Let the given weight of the new boy be y.
So, (The sum of the weight of 34 students + The required weight of the new boy) / 35 = 47
(1581+ y)/ 35 = 47
1581 + y = 1645
y = 1645 – 1581 = 64kg.
Therefore, the weight of the teacher is 64kg.
Question 18: In the class intervals 10-20 and 20-30, the given number 20 is also included
(a) in 10-20 (b) in 20-30
(c) in Both the intervals (d) in None of these
Answer 18: (b) Since the class interval 10-20 is the first interval of frequency distribution and 20-30 is the next one, the number 20 is present in both intervals. We understand that the presence of 20 in the interval 10-20 is not 100%, while in the next interval, 20-30, the presence is 100%.
Question 19: Transform the assigned frequency distribution into a continuous grouped frequency distribution
| Class interval | Frequency |
| 150 - 153 | 7 |
| 157 - 157 | 7 |
| 158 - 161 | 15 |
| 162- 165 | 10 |
| 166 - 165 | 5 |
| 170 - 173 | 6 |
In which following intervals would 153.5 and 157.5 be included?
Answer 19: The given table is in inclusive (discontinuous) form. So, we first convert it into a complete form.
Now, consider the classes 150-153, 154-157
The required lower limit of 154-157 = 154
The required upper limit of 150-153=153
The given required difference = 154 -153 = 1
The given half the difference = 1/2 = 0.5
We subtract 0.5 from every lower limit and add 0.5 to each upper limit.
The required table for continuous grouped frequency distribution is given below.
| Class interval | Frequency |
| 149.5 -153.5 | 7 |
| 153.5 - 157.5 | 7 |
| 157.5 - 161.5 | 15 |
| 161.5 - 165.5 | 10 |
| 165.5 - 169.5 | 5 |
| 169.5 - 173.5 | 6 |
Therefore, 153.5 and 157.5 would be used in the class intervals 153.5-157.5 and 157.5-161.5, respectively.
Question 20: The expenditure on a country's education during a five-year period (2002-2006), in crores of rupees, is given below.
| Elementary Education | 240 |
| Secondary Education | 120 |
| University Education | 190 |
| Teacher’s Training | 20 |
| Social Education | 10 |
| Other Educational Programmes | 115 |
| Cultural Programmes | 25 |
| Technical Education | 125 |
Illustrate the information above by a bar graph.
Answer 20: We draw a given bar graph of this data in the following steps
Step I: We represent a country's education (variable) on the horizontal axis, selecting any scale, as the bar's width is unimportant. But for clarity, we take equivalent widths for all bars and maintain equal gaps between them. Let a given head be represented by one unit.
Step II We describe the expenditure on the vertical axis. Since the maximum expenditure is Rs. 240 crores, we can choose the scale as 1 unit = Rs. 25 crores.
Step III To represent our first education in a country, i.e., elementary education, we draw a rectangular bar with a width of 1 unit and height of 9.6 units.
Step IV Also, the different heads are represented by leaving a gap of ~ unit between the two consecutive bars.
The required bar graph for the given data is displayed below.
Question 21: The given number of books issued to 13 students in a class is:
19, 24, 23, 29, 31, 19, 20,25, 22, 26, 17, 35, 21.
Find the required median no. of books for the above data.
Answer 21: Let’s arrange the data given in the ascending order – 17, 19, 19, 20, 21, 22, 23, 24, 25,25, 26, 29, 31, 35.
n= 13, It’s a given odd number
Median of the no. of books = ( n + 1 ) / 2 given observations
= ( 13 + 1 )/ 2
= ( 14 / 2 )th observation
= 7th observation
= 23
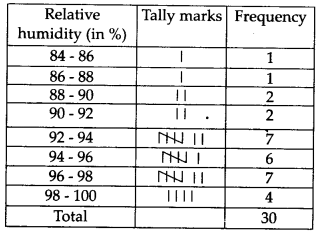
Question 22: The required relative humidity (in %) of a particular city for a month of 30 days was as follows:
98.1 98.6 99.2 90.3 86.5 95.3 92.9 96.3 94.2
95.1 89.2 92.3 97.1 93.5 92.7 95.1 97.2 93.3
95.2 97.3 96.2 92.1 84.9 90.2 95.7 98.3 97.3
96.1 92.1 89
(i) Create a grouped frequency distribution table with classes 84-86, 86-88 etc.
(ii) Which given month or season do you think this data is about?
(iii) What is the required range of this data?
Answer 22:
Here, the given lowest value of observation = 84.9
The highest required value of observation = 99.2
Hence,The class intervals are 84 – 86, 86 – 88, 88 – 90, ……. , 98 – 100
(i) Therefore, the necessary frequency distribution table is
Image source: https://www.learncbse.in/wp-content/uploads/2020/10/NCERT-Solutions-for-Class-9-Maths-Chapter-14-Statistics-Ex-14.2-Q3.1.png
(ii) Since the approximate humidity is high during the rainy season, the data appears to be taken in the rainy season.
(iii) Range = (Highest observation) – (Lowest observation) = 99.2 – 84.9 = 14.3
Question 23: A given grouped frequency table with class intervals of equal sizes utilising 250-270 (270 not contained in this interval) as one of the class intervals is constructed for the necessary following data
268, 220, 300,368, 258, 242, 310, 272, 342,
310, 290, 258, 320, 319, 304, 402, 318,
406,240, 292, 354, 278, 210, 330, 316,
406, 215, 236.
The required frequency of the class 310-330 is
(a) 4 (b) 5 (c) 6 (d) 7
Answer 23: (c) We arrange the given data into groups like 210-230, 230-250, and 390-410.
(The given data is from 210 to 406). The required class width, in this case, is 20.
Then, the given data can be arranged in tabular form as follows.
Therefore, the frequency of the class 310-330 is 6.
Question 23: The following table gives the frequencies of the most commonly used letters, o, e, i, o, r, t, u, from a book page.
| Letters | a | e | i | o | r | t | u |
| Frequency | 75 | 125 | 80 | 70 | 80 | 95 | 75 |
Express the information above by a bar graph.
Answer 23:
Drawing a bar graph of this data in the given following steps.
Step I: We express the letters (variable) on the horizontal axis by selecting any scale, as the bar's width is unimportant. But for clarity, we take equivalent widths for all bars and maintain equivalent gaps between them. Let one letter be expressed by one unit.
Step II We express the letters on the vertical axis. Since the highest frequency is 125, we can determine the scale as 1 unit = 15 frequency.
Step III To express our first letter, a, we sketch a rectangular bar with a width of 1 unit and height of 5 units.
Step IV Also, other heads are expressed by leaving a gap of 1/2 unit between two consecutive bars.
The required bar graph for the given data is shown below.
Question 24: The following are the given marks (out of 100) of 60 students in Mathematics. 16, 13, 5, 80, 86, 44, 7, 51, 48, 24, 56, 70, 28, 19, 61, 17, 16, 36, 34, 42, 34, 35, 15, 72, 55, 75, 31, 52, 72, 97, 74, 45, 62, 68, 78, 86, 35, 85, 36, 81, 75, 55, 26, 95, 31, 7, 78, 92, 62, 52, 56, 63, 25, 36, 54, 27, 72, 17, 4, 47, 30.
Create a grouped frequency distribution table with a width 10 of for every class starting from 0-9.
Answer 24: First, put the given data in ascending order.
4, 5, 7, 7, 13, 15, 16, 16, 17, 17, 19, 24, 25, 26, 27, 28, 30, 31, 31, 34, 34, 35, 35, 36, 36, 36, 42, 44, 45, 47, 48, 51, 52, 52, 54, 55, 55, 56, 56, 61, 62, 62, 63, 68, 70, 72, 72, 72, 74, 75, 75, 78, 80, 81, 85, 86, 86, 92, 95, 97.
We put the given data into groups like 0-9, 10-19, 20-29, … The class width in every case is 10.
The given frequency distribution of the given data is given below.
Question 25: The mean of 20 observations is 17. If, in the observations, observation 40 is substituted by 12, find the required new mean.
Answer 25: The mean of 20 observations is 17
The sum of the 20 observations = 17 x 20 = 340
The required new sum of 20 observations = 340 – 40 + 12 = 312
The required new mean=312 / 20 =15.6
Question 26: Create a grouped frequency distribution table with width 10 of every class so that one of the classes is 10-20 (20 not included).
Answer 26: We arrange the given data into groups like 0-10, 10-20, 20-30, ………… in which upper class limit is not included in that class. The class width in each case is 10. The frequency distribution of the given data is given below
Image source
:https://learnqa.s3.ap-south-1.amazonaws.com/images/16107032461988941788G0HinbMukxDreGy1.png
Question 27: The required mean of 36 observations is 12. One observation, 47, was misread as 74. Find the correct mean.
Answer 27: Mean of 36 observations = 12
Total of 36 observations = 36 x 12 = 432
The required correct sum of 36 observations = 432 – 74 + 47 = 405
The required correct mean of 36 observations = 405/ 36 =11.25
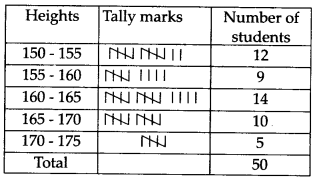
Question 28: The required heights of 50 students, measured to the nearest centimetres, are as follows.
161 150 154 165 168 161 154 162 150 151
162 164 171 165 158 154 156 172 160 170
153 159 161 170 162 165 166 168 165 164
154 152 153 156 158 162 160 161 173 166
161 159 162 167 168 159 158 153 154 159
(i) Describe the data given above by a grouped frequency distribution table, taking the required class intervals as 160 – 165, 165 – 170 etc.
(ii) What can you infer about their heights from the table?
Answer 28(i) The lowest value of the observation = 150
The highest value of the observation = 173
∴ Class intervals are 150 – 155, 155 -160, …, 170 – 175.
The required frequency distribution table is
Image source: https://www.learncbse.in/wp-content/uploads/2020/10/NCERT-Solutions-for-Class-9-Maths-Chapter-14-Statistics-Ex-14.2-Q4.1.png
(ii) From the table above,Students with 160−165cm heights are maximum, that is, 14 students.
Question 29:Sketch a histogram of the following distribution
| Height (in cm) | Number of students |
| 150 - 153 | 7 |
| 153 - 156 | 8 |
| 156 - 159 | 14 |
| 159 - 162 | 10 |
| 162 - 165 | 6 |
| 162 - 168 | 5 |
Answer 29:
Question 30:Sketch a histogram to illustrate the following grouped frequency distribution
| Age ( in years ) | Numbers of teachers |
| 20 - 24 | 10 |
| 25 - 29 | 28 |
| 30 - 34 | 32 |
| 35 - 39 | 48 |
| 40 - 44 | 50 |
| 45 - 49 | 35 |
| 50 - 54 | 12 |
Thinking Process
- Firstly, convert the given data into continuous form by adjusting minus 0.5 in the lower limit and plus 0.5 in the upper limit.
- Further, we take height in the horizontal axis and frequency in the vertical axis. Corresponding height frequencies are plotted in rectangular form and get the required histogram.
Answer 30: The required frequency distribution is in inclusive form. So, first, we convert it into complete form.
Now, consider the classes 20-24 and 25-29.
The required lower limit of 25-29 is 25.
The required upper limit of 20-24 is 24.
Therefore, the half of the difference is = (25- 24)/2= ½ = 0.5
Subtracting 0.5 from every lower limit and adding 0.5 to every upper limit.
The required table for continuous grouped frequency distribution is given below.
| Age ( in years ) | Number of Teacher |
| 19.5 - 24.5 | 10 |
| 24.5 - 29.5 | 28 |
| 29.5 - 34.5 | 32 |
| 34.5 - 39.5 | 48 |
| 39.5 - 44.5 | 50 |
| 44.5 - 49.5 | 35 |
| 49.5 - 54.5 | 12 |
Thus, the given data becomes in a complete form.
Along the given horizontal axis, we describe the class intervals of ages on some suitable scale. The corresponding frequencies of the given number of teachers are described along the vertical axis on a suitable scale.
Since the given intervals start with 19.5-24.5, there is some break (vw) indicated around the origin to represent the graph drawn with a scale beginning at 19.5.
A required histogram of the given distribution is given below.
Question 31: If the mean of five observations x, x + 2, x + 4, x + 6, x + 8 is 11, then write the value of x.
Answer 31: We understand that,
Mean =The total number of required observations/ The sum of the given observation
Sum of the given observations =x+(x+2)+(x+4)+(x+6)+(x+8)
= x + x + 2 + x + 4 + x + 6 + x +8
= 5x + 20
Total number of observations =5
Therefore, Mean =5(5x+20)
Also, Mean =11
(given)
⇒11=5(5x+20)
⇒55=5x+20
or x=7
Question 32:A certain study was executed to discover the concentration of the given sulphur dioxide in the air in parts per million (ppm) of a respective city. The data acquired for 30 days is as follows.
0.03 0.08 0.08 0.09 0.04 0.17
0.16 0.05 0.02 0.06 0.18 0.20
0.11 0.08 0.12 0.13 0.22 0.07
0.08 0.01 0.10 0.06 0.09 0.18
0.11 0.07 0.05 0.07 0.01 0.04
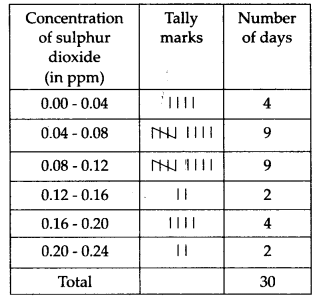
(i) Create a grouped frequency distribution table for this data with class intervals as 0.00 – 0.04, 0.04 – 0.08 and so on.
(ii) For how many required days was the concentration of sulphur dioxide more than 0.11 parts per million?
Answer 32: (i)The required lowest value of the observation = 0.01
The given highest value of the observation = 0.22
∴The given Class intervals are 0.00 – 0.04, 0.04 – 0.08,……., 0.20 – 0.24
The necessary frequency distribution table is
Image source: https://www.learncbse.in/wp-content/uploads/2020/10/NCERT-Solutions-for-Class-9-Maths-Chapter-14-Statistics-Ex-14.2-Q5.1.png
(ii) The given concentration of sulphur dioxide was more than 0.11 ppm for eight days.
Question 33: Determine the mean of the first 10 natural numbers.
Answer 33: A given natural number is an integer greater than 0. The natural numbers begin at 1 and increment to infinity: 1, 2, 3, 4, 5, etc.
Accordingly, the first ten natural numbers are 1, 2, 3, 4, 5, 6, 7, 8, 9, and 10.
And the required mean of three numbers a, b, c is a + b + c3a + b + c3.
Then the given mean of 10 numbers 1, 2, 3, 4, 5, 6, 7, 8, 9, 10 is:-
1 + 2 + 3 + 4 + 5 + 6 + 7 + 8 + 9 + 10/10
1+2+3+4+5+6+7+8+9+10/10
Add and divide; we get the value of the above term as,
1 + 2 + 3 + 4 + 5 +6 + 7 + 8 + 9 + 10 / 10 =5510=5.5
1+2+3+4+5+6+7+8+9+10/10=5510=5.5
Hence, the mean of the first 10 natural numbers is 5.5.
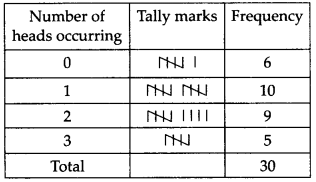
Question 34:Three given coins were tossed 30 times simultaneously. Separately each time, the required number of heads appearing was noted down as follows.
0 1 2 2 1 2 3 1 3 0
1 3 1 1 2 2 0 1 2 1
3 0 0 1 1 2 3 2 2 0
Prepare a required frequency distribution table for the data given above.
Answer 34: The required frequency distribution table is.
Image source: https://www.learncbse.in/wp-content/uploads/2020/10/NCERT-Solutions-for-Class-9-Maths-Chapter-14-Statistics-Ex-14.2-Q6.1.png
Question 35: The required lengths of 62 leaves of a plant are estimated in millimetres, and the data is expressed in the following table.
| LENGTH (IN MM) | NUMBER OF LEAVES |
| 118 - 126 | 8 |
| 127 - 135 | 10 |
| 136 - 144 | 12 |
| 145 - 153 | 17 |
| 154 - 162 | 7 |
| 163 - 171 | 5 |
| 172 - 180 | 3 |
Sketch a histogram to express the data above.
Thinking Process
- Firstly, transform the given distribution into exclusive form by using the adjusting factor (127-126)/2 = 0.5
- Further, subtract 0.5 from every lower limit and add 0.5 to every upper limit.
- Finally, sketch a histogram using the altered data.
Answer 35: The required frequency distribution is in inclusive form. So, first, we transform it into complete form.
Now, adjusting factor = (127 -126)/2 = ½ = 0.5
So, we subtract 0.5 from every lower limit and add 0.5 to every upper limit.
The required table for continuous grouped frequency distribution is given below.
| LENGTH ( IN MM) | NUMBER OF LEAVES |
| 117.5 - 126.5 | 8 |
| 126.5 - 135.5 | 10 |
| 135.5 - 144.5 | 12 |
| 144.5 - 153.5 | 17 |
| 153.5 - 162.5 | 7 |
| 162.5 - 171.2 | 5 |
| 171.5 - 180.5 | 3 |
The table for continuous grouped frequency distribution is given below
Therefore, the given data becomes in complete form.
Along the horizontal axis, we represent the class intervals of length on some suitable scale. The related frequencies of the number of leaves are represented along the Y-axis on a suitable scale.
Since the given intervals start with 117.5-126.5, some break (vw) is indicated near the origin to symbolise the graph drawn with a scale beginning at 117.5.
A required histogram of the given distribution is given below.
Question 36:The mean of 8 observations is 40. If 5 is added to each observation, find the value of the new mean.
Answer 36:
We know that Mean=Sum of terms/number of terms.
As given
Mean=40 and number of terms=8 so
40=Sum of terms/8
Sum of terms=40*8=320 now, by increasing each term by 5, sums of terms will increase by 8*5=40, so the new Sum will be
Sum of terms=320+40=360
Again solving to find mean
Mean=Sum of terms/number of terms
Mean=360/8=45
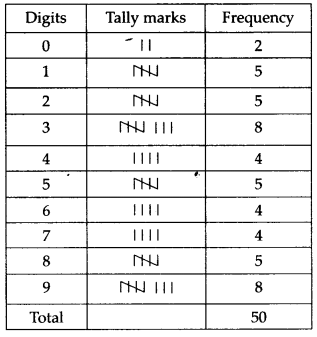
Question 37: The given value of π up to 50 decimal places is given below
3.14159265358979323846264338327950288419716939937510
(i) Create a frequency distribution of the digits from 0 to 9 after the decimal point.
(ii) What are the required most and the required least frequently occurring digits?
Answer 37: (i) The required frequency distribution table
Image source: https://www.learncbse.in/wp-content/uploads/2020/10/NCERT-Solutions-for-Class-9-Maths-Chapter-14-Statistics-Ex-14.2-Q7.png
(ii) The maximum frequently occurring digits are 3 and 9 is 8 times, and the least frequently occurring digit 0 is 2times.
Question 38:Discover the range of the required data: 25, 18, 20, 10, 22, 16, 6, 17, 15, 12, 30, 32, 19, 8, 11, 20
Answer 38: The range of the data= Highest value-lowest value
Highest value= 36
Lowest value=6
∴Range of the data=32−6=24
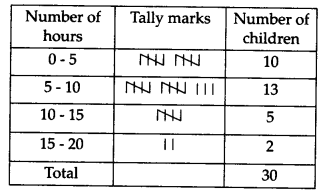
Question 39: Thirty given children were asked about the number of hours they watched TV programmes in the previous week.
The results were found as follows.
1 6 2 3 5 12 5 8 4 8
10 3 4 12 2 8 15 1 17 6
3 2 8 5 9 6 8 7 14 12
Answer 39: (i) Create a grouped frequency distribution table for this data, taking class width 5 and one of the class intervals 5 – 10.
(ii) How many required children watch television for 15 or more hours a week?
Solution:
(i) Now, the required lowest value of the observation = 1 and the required highest value of the observation = 17
∴ The given Class intervals are 0 – 5, 5 – 10 ., 15 – 20
The necessary frequency distribution table is
Image source: https://www.learncbse.in/wp-content/uploads/2020/10/NCERT-Solutions-for-Class-9-Maths-Chapter-14-Statistics-Ex-14.2-Q8.1.png
(ii) The required number of children who watched television for 15 or more hours per week = 2.
Question 40: Find the median of the values 37, 31, 42, 43, 46, 25, 39, 45, 32.
Answer 40: Arranging the values in ascending order,
25,31,32,37,39,42,43,45,46
Here, n=9
Median = Value of [(29+1)/2]th observation
=Value of 5th observation = 39.
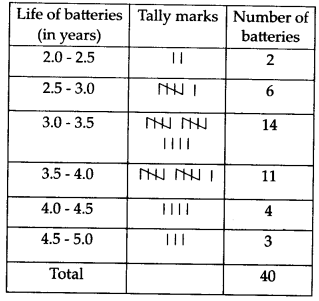
Question 41: A required company manufactured car batteries of a certain type. The required lives (in years) of 40 such batteries were registered as follows.
2.6 3.0 3.7 3.2 2.2 4.1 3.5 4.5
3.5 2.3 3.2 3.4 3.8 3.2 4.6 3.7
2.5 4.4 3.4 3.3 2.9 3.0 4.3 2.8
3.5 3.2 3.9 3.2 3.2 3.1 3.7 3.4
4.6 3.8 3.2 2.6 3.5 4.2 2.9 3.6
Construct a grouped frequency distribution table for this data, using class intervals of size 0.5 starting from interval 2 – 2.5.
Question 41: Here, the required lowest value of the observation = 2.2
and the required highest value of the observation = 4.6
∴ The required class intervals are 2.0 – 2.5, 2.5 – 3.0, …., 4.5 – 5.0
The necessary frequency distribution table is.
Image source: https://www.learncbse.in/wp-content/uploads/2020/10/NCERT-Solutions-for-Class-9-Maths-Chapter-14-Statistics-Ex-14.2-Q9.1.png
Question 42: Find the mode of the following scores : 14, 25, 14, 28, 18, 17, 18, 14, 23, 22, 14, 18
Answer 42: Ascending order:
14,14,14,14,17,18,18,18,22,23,25,28
14 has the highest frequency:4 times
Mode =14
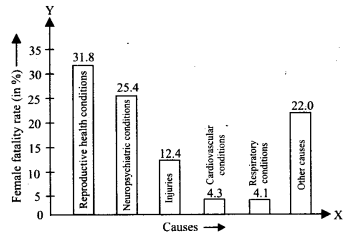
Question 43: A survey conducted by an organisation for the cause of illness and death among women between the ages 15-44 (in years) worldwide found the following figures (in %)
| SR. NO | CAUSES | FEMALE FATALITY RATE (IN %) |
| 1 | REPRODUCTIVE HEALTH CONDITIONS | 31.8 |
| 2 | NEUROPSYCHIATRIC CONDITIONS | 25.4 |
| 3 | INJURIES | 12.4 |
| 4 | CARDIOVASCULAR CONDITIONS | 4.3 |
| 5 | RESPIRATORY CONDITIONS | 4.1 |
| 6 | OTHER CAUSES | 22.0 |
(i) Illustrate the information given above graphically.
(ii) Which condition is the main cause of women’s ill health and death worldwide?
(iii) Attempt to find out, with your teacher's support, that any two factors that play a significant role in the cause in (ii) the above are the primary cause.
Answer 43: (i) The required graphical representation is shown as follows:
Image source: https://www.learncbse.in/wp-content/uploads/2020/10/NCERT-Solutions-for-Class-9-Maths-Chapter-14-Statistics-Ex-14.3-Q1.1.png
(ii) The main cause of women’s ill health as well as death worldwide is ‘reproductive health conditions.
(iii) Factors are:
(i) Medical infrastructure in work.
(ii) Lack of treatment facilitators and facilities.
Image source: https://d1hj4to4g9ba46.cloudfront.net/questions/492881_464412_ans.png
Question 44: The median of the data 26,56,32,33,60,17,34,29,45 is 33. If the number 26 is replaced by 62, then see the new median.
Answer 44: Arranging numbers in ascending order
17,26,29,32,33,34,45,56,60
Here n = 9, which is odd.
So Median =( (n+1)/2) th term
Median = ((9+1)/2)th term
Median = (10/2)th term
Median = 5th term
Median = 33
Hence the median is 33.
If 26 is replaced by 62, a new set of numbers in ascending order is shown below.
17,29,32,33,34,45,56,60,62
Here n = 9, which is odd.
So Median =( (n+1)/2) th term
Median = ((9+1)/2)th term
Median = (10/2)th term
Median = 5th term
Median = 34
Hence the median is 34.
Question 45: The following given data on the number of girls (to the nearest ten) per thousand boys in various sections of Indian society are provided below.
| SECTION | NUMBER OF GIRLS PER THOUSANDS BOYS |
| SCHEDULED CASTE (SC) | 940 |
| SCHEDULED TRIBE (ST) | 970 |
| NON SC/ST | 920 |
| BACKWARD DISTRICTS | 950 |
| NON-BACKWARDS DISTRICTS | 920 |
| RURAL | 930 |
| URBAN | 910 |
(i) Illustrate the information above by a bar graph.
(ii) In the classroom, examine what conclusions can be arrived at from the graph.
Answer 45:
(i) The required bar graph is shown below:
Image source: https://d1hj4to4g9ba46.cloudfront.net/questions/492885_464414_ans.png
(ii) We conclude that the number of girls per thousand boys is maximum in the scheduled tribe section whereas minimum in the urban section.
Question 46: The required mid-value of a class interval is 42. If the class size is 10, find the upper and lower limits of the class.
Answer 46:Let the required upper limit and lower limit be x and y
⇒ x+y/2 =42 [ Given ]
∴ x+y=84 ------ ( 1 )
Now, according to the question,
⇒ x−y=10 ------ ( 2 )
Adding equations ( 1 ) and ( 2 ), we obtain,
2x=94
∴ x=47
And 47−y=10
∴ y=37
∴ Needed class interval =37−47
Lower class limit = 37
Upper class limit = 47
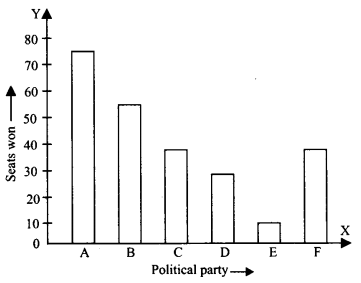
Question 47: Below are the seats won by various political parties in the polling outcome of state body elections.
| POLITICAL PARTY | SEATS WON |
| A | 75 |
| B | 55 |
| C | 37 |
| D | 29 |
| E | 10 |
| F | 37 |
(i) Illustrate a bar graph to illustrate the required polling results.
(ii) Which political party has won the maximum number of seats?
Answer 47: (i) The needed bar graph is shown below:
Image source: https://www.learncbse.in/wp-content/uploads/2020/10/NCERT-Solutions-for-Class-9-Maths-Chapter-14-Statistics-Ex-14.3-Q3.1.png
(ii) The political party A won the maximum number of seats.
Question 48: The given mean weight per student in a group of 7 students is 55 kg. The individual weights of 6 of them in kg are 52, 54, 55, 53, 56, and 54. Find the required weight of the seventh student.
Answer 48: The required mean weight per student in a group of 7 students is 55kg.
Mean weight of 7 students=55kg
No. of students=7
∴ Mean=No. of observations sum of observations=7sum of weights of 7 students
55×7= sum of weights of 7 students
Sum of weights of 7 students=385kg
and given individual weights of 6 of them(in kg), are
52,54,53,55,56 & 54
Total weights of 6 students
=52+54+55+53+56+54
=324 kg
∴ The weight of the seventh student
=Total weights of 7 students− total weights of 6 students
=385−324
=61 kg.
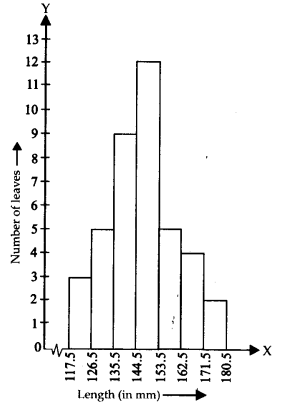
Question 49: The length of 40 leaves of a plant measured correct to one millimetre and the acquired data is represented in the following table.
| LENGTH ( IN MM ) | NUMBER OF LEAVES |
| 118 - 126 | 3 |
| 127 - 135 | 5 |
| 136 - 144 | 9 |
| 145 - 153 | 12 |
| 154 - 162 | 5 |
| 163 - 171 | 4 |
| 172 - 180 | 2 |
(i) Illustrate a given histogram to depict the given data.
(ii) Is there any additional suitable graphical representation for the same data?
(iii) Is it right to assume that the given maximum number of leaves is 153 mm lengthy, and Why?
Answer 49: (i) The required frequency distribution table is not continuous. Accordingly, first, we have to modify it to be continuous distribution.
Consequently, the modified frequency distribution table is:
| LENGTH ( IN MM ) | NUMBER OF LEAVES |
| 117.5 - 126.5 | 3 |
| 126.5 - 135.5 | 5 |
| 135.5 - 144.5 | 9 |
| 144.5 - 153.5 | 12 |
| 153.5 - 162.5 | 5 |
| 162.5 - 171.5 | 4 |
| 171.5 - 180.5 | 2 |
Here, the required histogram of the frequency distribution is shown below :
Image source: https://www.learncbse.in/wp-content/uploads/2020/10/NCERT-Solutions-for-Class-9-Maths-Chapter-14-Statistics-Ex-14.3-Q4.2.png
(ii) Yes, another suitable graphical representation is a ‘frequency polygon’.
(iii) No, it is not the right statement. The required maximum number of leaves lies in the class interval 145 – 153.
Question 50: A required grouped frequency distribution table with classes of equal sizes using 63-72 (72 included) as one of the classes is constructed for the following data 44,30, 32, 45, 54, 74, 78, 108, 112, 66, 76, 88,
40, 14, 20, 15, 35, 66, 75, 84, 95,
102, 110, 88, 74, 112, 14, 96, 34, 44.
The required number of classes in the distribution
(a) will be 9 (b) will be 10 (c) will be 11 (d) will be 12
Answer 50: (b) We put the given data into groups like 13-22,23-32 and 103-112. (since our given data is
from 14 to 112). The required class width, in this case, is 9.
The required data can be put in tabular form as follows.
Therefore, the given number of classes in distribution will be 10.
Question 51: Ten required observations 6, 14, 15, 17, x + 1, 2x – 13, 30, 32, 34, 43 are written in ascending order. The median of the data is 24. Find the value of x.
Answer 51: As the median of the 10 numbers is 24.
So,1/2(5th number+6th number)=24
x+1+2x−13/2=24
3x−12/2=24
3x=60
x=20
So, 5th number=x+1=21
6th number=2x-13=27
So, mean=
6+14+15+17+21+27+30+32+34+43/10 =23.9
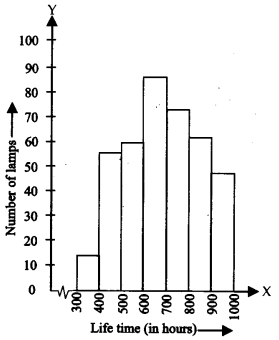
Question 52: The required following table gives the lifetimes of 400 neon lamps.
| LIFE TIME ( IN HOURS ) | NUMBER OF LAMPS |
| 300 - 400 | 14 |
| 400 - 500 | 56 |
| 500 - 600 | 60 |
| 600 - 700 | 86 |
| 700 - 800 | 74 |
| 800 - 900 | 62 |
| 900 - 1000 | 48 |
(i) Illustrate the given information with the help of a histogram.
(ii) How many given lamps have a lifetime of more than 700 h?
Answer 52: (i) The required histogram is shown below:
Image source: https://www.learncbse.in/wp-content/uploads/2020/10/NCERT-Solutions-for-Class-9-Maths-Chapter-14-Statistics-Ex-14.3-Q5.1.png
(ii) The given number of lamps having a lifetime of more than 700 hours = 74 + 62 + 48 = 184 lamps.
Question 53: The given mean of 25 observations is 36. Out of these observations, if the required mean of the first 13 observations is 32 and that of the last 13 of the given observations is 40, the 13th observation
(a) is 23 (b) is 36 (c) is 38 (d) is 40
Answer 53: (b) Given, The given mean of 25 observations = 36
∴ The required sum of 25 observations = 36 x 25 = 900 Now, the mean of first 13 observations = 32
∴ The required sum of first 13 observations = 13 x 32 = 416 and the mean of last 13 observations = 40
∴ The required sum of last 13 observations = 40 x 13 = 520
Now, The 13th observation = (The given sum of the last 13 observations + The given sum of the first 13 observations) – (The given sum of 25 observations)
=(520 + 416)-900 = 936 – 900 = 36
Therefore, the 13th observation is 36.
Question 54: Thirty required children were asked about the number of hours they watched TV programmes in the previous week.
The given results were seen as follows :
1 6 2 3 9 12 5 8 4 8
10 3 4 5 2 8 15 1 17 6
3 2 8 5 12 6 8 7 14 12
(i) Create a grouped frequency distribution table for this data, taking class width 5 and one of the class
intervals as 5-10.
(ii) How many children watch television for 15 or more hours a week?
Answer 54: (i) A grouped frequency distribution table can be constructed as follows with the class intervals of 0 - 5, 5 - 10, 10 - 15, 15 - 20, and so on.
| NUMBERS OF HOURS | NUMBER OF CHILDREN |
| 0 - 5 | 10 |
| 5 - 10 | 13 |
| 10 - 15 | 5 |
| 15 - 20 | 2 |
| TOTAL | 30 |
(ii) From the provided table, we can conclude that 2 children watched television for 15 or more hours a week.
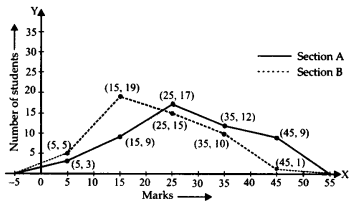
Question 55: The following table shows students' distribution in two sections according to their marks.
| SECTION A | SECTION A | SECTION B | SECTION B |
| MARKS | FREQUENCY | MARKS | FREQUENCY |
| 0 - 10 | 3 | 0 - 10 | 5 |
| 10 - 20 | 9 | 10 - 20 | 19 |
| 20 - 30 | 17 | 20 - 30 | 15 |
| 30 - 40 | 12 | 30 - 40 | 10 |
| 40 - 50 | 9 | 40 - 50 | 1 |
Illustrate the marks of the students of both sections on the same graph by two frequency polygons. The two polygons approximate the performance of the two sections.
Answer 55: To draw a frequency polygon, we mark the class marks along the x-axis. Thus, the modified table is as follows:
| MARKS | CLASS MARK | FREQUENCY SECTION A | FREQUENCY SECTION B |
| 0 - 10 | 5 | 3 | 5 |
| 10 - 20 | 15 | 9 | 19 |
| 20 - 30 | 25 | 17 | 15 |
| 30 - 40 | 35 | 12 | 10 |
| 40 - 50 | 45 | 9 | 1 |
Hence, the given two frequency polygons are as shown below:
Image source: https://www.learncbse.in/wp-content/uploads/2020/10/NCERT-Solutions-for-Class-9-Maths-Chapter-14-Statistics-Ex-14.3-Q6.2.png
From the above-given frequency polygon, we can observe that more students of section A have secured well.
Question 56: In a given sample study of 642 people, it was seen that 514 people have a high school certificate. If a person is chosen at random, the required probability that the person has a high school certificate,
(a) is 0.5 (b) is 0.6 (c) is 0.7 (d) is 0.8
Answer 56: (d) The required total number of people in the sample study, n(S) = 642.
The required number of people with a high school certificate is n(E) = 514.
Now, the necessary probability that the person selected has a high school certificate
= n(E)/n(S)=514/642 = 0.8
Hence, the necessary probability that the person has a high school certificate is 0.8.
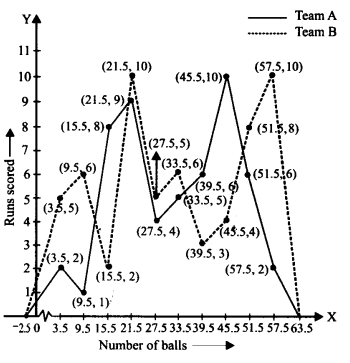
Question 57: The runs achieved by two teams, A and B, on the first 60 balls in a cricket match are given below.
| NUMBER OF BALLS | TEAM A | TEAM B |
| 1 - 6 | 2 | 5 |
| 7 - 12 | 1 | 6 |
| 13 - 18 | 8 | 2 |
| 19 - 24 | 9 | 10 |
| 25 - 30 | 4 | 5 |
| 31 - 36 | 5 | 6 |
| 37 - 42 | 6 | 3 |
| 41 - 48 | 10 | 4 |
| 49 - 54 | 6 | 8 |
| 55 - 60 | 2 | 10 |
Describe the data of both teams on the same graph by frequency polygons.
Answer 57: The provided class intervals are not continuous. Accordingly, we first adjust the distribution as continuous.
| NUMBER OF BALLS | CLASS MARK | FREQUENCY
TEAM A |
FREQUENCY
TEAM B |
| 0.5 - 6.5 | 3.5 | 2 | 5 |
| 6.5 - 12.5 | 9.5 | 1 | 6 |
| 12.5 - 18.5 | 15.5 | 8 | 2 |
| 18.5 - 24.5 | 21.5 | 9 | 10 |
| 24.5 - 30.5 | 27.5 | 4 | 5 |
| 30.5 - 36.5 | 33.5 | 5 | 6 |
| 36.5 - 42.5 | 39.5 | 6 | 3 |
| 42.5 - 48.5 | 45.5 | 10 | 4 |
| 48.5 - 54.5 | 51.5 | 6 | 8 |
| 54.5 - 60.5 | 57.5 | 2 | 10 |
Currently, the necessary frequency polygons are as exhibited below:
Image source: https://www.learncbse.in/wp-content/uploads/2020/10/NCERT-Solutions-for-Class-9-Maths-Chapter-14-Statistics-Ex-14.3-Q7.2.png
Question 58: A given survey of 364 children aged 19-36 months found that 91 liked to eat potato chips. If a child is chosen at random, the probability that they do not like to eat potato chips is
(a) 0.25 (b) 0.50 (c) 0.75 (d) 0.80
Answer 58: (c) Total number of survey children aged 19-36 months, n(S) = 364 In those of them, 91 out of them liked to eat the required potato chips.
∴ The required number of children who dislike eating potato chips, n(E) = 364 – 91 = 273
∴ The required probability that he/she does not like to eat potato chips = n(E)/n(S) = 273/364 = 0.75
Hence, the probability that they do not like to eat potato chips is 0.75.
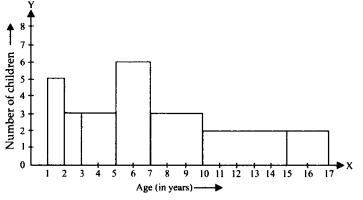
Question 59: An adhoc survey data of the number of children of various age groups playing in a football park is given below:
Illustrate a histogram to represent the data below.
Image Source: Internet
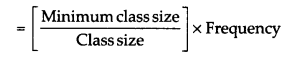
Answer 59: The class sizes are different. So, we estimate the adjusted frequencies corresponding to each rectangle, that is, the length of the rectangle.
Modified frequency or length of the rectangle
Image source: https://www.learncbse.in/wp-content/uploads/2020/10/NCERT-Solutions-for-Class-9-Maths-Chapter-14-Statistics-Ex-14.3-Q8.1.png
The required minimum class size = 2 – 1 = 1
∴ We have the required following table for adjusted frequencies or lengths of rectangles:
| AGE ( IN YEARS) | FREQUENCY | WIDTH OF THE CLASS | LENGTH OF THE RECTANGLE |
| 1 - 2 | 5 | 1 | 1/1 X 5 = 5 |
| 2 - 3 | 3 | 1 | 1/1 X 3 = 3 |
| 3 - 5 | 6 | 2 | 1/2 X 6 = 3 |
| 5 - 7 | 12 | 2 | 1/2 X 12 = 6 |
| 7 - 10 | 9 | 3 | 1/3 X 9 = 3 |
| 10 - 15 | 10 | 5 | 1/5 X 10 = 2 |
| 15 - 17 | 4 | 2 | 1/2 X 4 = 2 |
Now, the needed histogram is shown below:
Image source: https://www.learncbse.in/wp-content/uploads/2020/10/NCERT-Solutions-for-Class-9-Maths-Chapter-14-Statistics-Ex-14.3-Q8.3.png
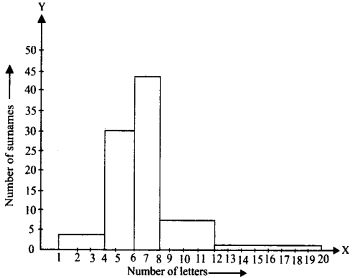
Question 60 : 100 given surnames were randomly picked up from a regional telephone directory, and frequency distribution of the given number of letters in the English alphabet in the surnames was noticed as follows
| NUMBER OF LETTERS | NUMBER OF SURNAMES |
| 1 - 4 | 6 |
| 4 - 6 | 30 |
| 6 - 8 | 44 |
| 8 - 12 | 16 |
| 12 - 20 | 4 |
(i) Illustrate a histogram to represent the given information.
(ii) Write the class interval where the required maximum number of surnames lie.
Answer 60: (i) Since class intervals of the given frequency distribution are unequal, the minimum class size = 6 – 4 = 2.
Thus, we have the following given table for the length of rectangles.
| NUMBER OF LETTERS | FREQUENCY | WIDTH OF THE CLASS | LENGTH OF THE RECTANGLE |
| 1 - 4 | 6 | 3 | 2/3 X 6 = 4 |
| 4 - 6 | 30 | 2 | 2/2 X 30 = 30 |
| 6 - 8 | 44 | 2 | 2/2 X 44 = 44 |
| 8 - 12 | 16 | 4 | 2/4 X 16 =8 |
| 12 - 20 | 4 | 8 | 2/8 X 4 = 1 |
The required histogram is shown below:
Image source: https://www.learncbse.in/wp-content/uploads/2020/10/NCERT-Solutions-for-Class-9-Maths-Chapter-14-Statistics-Ex-14.3-Q9.2.png
(ii) The required maximum frequency is 44, corresponding to class intervals 6 – 8.
∴ The required maximum number of surnames lies in the class interval 6 – 8.
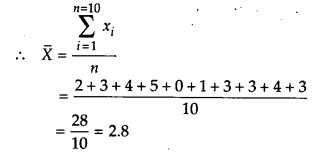
Question 61: The following given number of goals was acquired by a team in a sequence of 10 matches
2, 3, 1,4, 5, 0, 3, 3, 4, 3.
See the required mean, median and mode of these scores.
Answer 61: To find the mean :
Here, n = 10
Image source: https://www.learncbse.in/wp-content/uploads/2020/10/NCERT-Solutions-for-Class-9-Maths-Chapter-14-Statistics-Ex-14.4-Q1.png
Thus, mean = 2.8
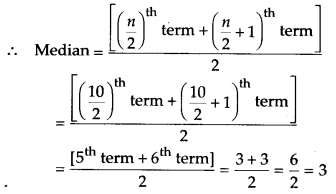
To find the median:
Now putting the given data in ascending order,
we have 0,1, 2, 3, 3, 3, 3, 4, 4, 5
∵ n = 10, an even number
Image source: https://www.learncbse.in/wp-content/uploads/2020/10/NCERT-Solutions-for-Class-9-Maths-Chapter-14-Statistics-Ex-14.4-Q1.1.png
Thus, median = 3
To find the mode:
In the given data, observation 3 occurs four times,
That is the maximum number of times.
Therefore, mode = 3
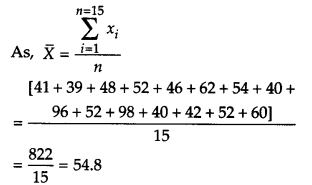
Question 62:In a given mathematics test is given to 15 students, the given following marks (out of 100) are recorded
52, 41, 39, 48, 52, 46, 62, 54, 40, 96, 98, 40, 42, 52, 60
Find the required mean, median and mode of this data.
Answer 62:
To find the mean:
Here, n = 15
Image source: https://www.learncbse.in/wp-content/uploads/2020/10/NCERT-Solutions-for-Class-9-Maths-Chapter-14-Statistics-Ex-14.4-Q2.png
Thus, mean = 54.8
To find the median:
Putting the required data in ascending order,
we have
52,39, 40, 40, 41, 42, 46, 48, 52, 52, 54, 60, 62, 96,98
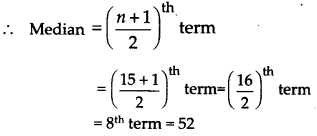
∵ n = 15, an odd number
Image source: https://www.learncbse.in/wp-content/uploads/2020/10/NCERT-Solutions-for-Class-9-Maths-Chapter-14-Statistics-Ex-14.4-Q2.1.png
Thus, median = 52
To find the mode:
In the given data, observation 52 occurs three times,
i.e., the maximum n
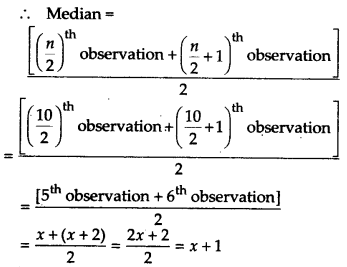
Question 63: The given following observations have been arranged in ascending order. If the required median of the data is 63, find the required value of x.
29, 48, 50, x, 32,x + 2, 72, 78, 84, 95
Answer 63: The given observations are in ascending order.
Since, n = 10 (an even number)
Image source: https://www.learncbse.in/wp-content/uploads/2020/10/NCERT-Solutions-for-Class-9-Maths-Chapter-14-Statistics-Ex-14.4-Q3.png
The median = 63 [Given]
∵ x + 1 = 63
x = 63 – 1
= 62
Therefore, the needed value of x is 62.
Question 64: Find the mode of 14, 25,14, 28,18,17,18,14, 23, 22,14 and 18.
Answer 64: Arranging the given data in ascending order, we have 14, 14, 14, 14, 17, 18, 18, 18, 22, 23 25, 28.
Since observation 14 is occurring the maximum number of times (i.e. 4 times)
∴ Mode of the given data = 14
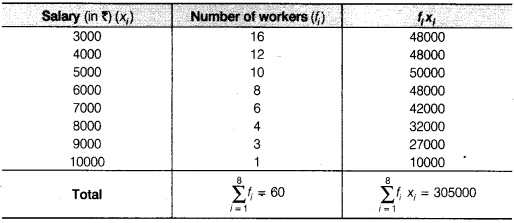
Question 65:Find the required mean salary of 60 workers of a factory from the following table
| SALARY( IN RUPEES ) | NUMBER OF WORKERS |
| 3000 | 16 |
| 4000 | 12 |
| 5000 | 10 |
| 6000 | 8 |
| 7000 | 6 |
| 8000 | 4 |
| 9000 | 3 |
| 10000 | 1 |
| TOTAL | 60 |
Answer 65:
Image source: https://www.learncbse.in/wp-content/uploads/2020/10/NCERT-Solutions-for-Class-9-Maths-Chapter-14-Statistics-Ex-14.4-Q5.1.png
Therefore, the required mean salary = Rs. 5083.33
Question 66: Provide one example of a situation in which
(i) the required mean is an appropriate measure of central tendency.
(ii) the required mean is not an appropriate measure of central tendency, but the median is a suitable measure.
Answer 66: (i) While if we take the case of calculating the weight of students in a class, then we should use the mean rather than the median. In such cases, taking the median is not suitable.
(ii) If the score of students in a class are 1,2,3,4,20
So if we calculate the mean =51+2+3+4+20=530=6
Median =3
So, the median is a better or appropriate measure because 20 is much greater than other numbers, and because of 20, the mean has come out to 6.
∴ It's better to take the median than the mean.
Question 67: A given survey of 364 children aged 19-36 months found that 91 liked to eat potato chips. If a child is chosen at random, the probability that they do not like to eat potato chips
(a) is 0.25 (b) is 0.50 (c) is 0.75 (d) is0.80
Answer 67: (c) Total number of survey children aged 19-36 months, n(S) = 364 In those of them, 91 out of them liked to eat the required potato chips.
∴ The required number of children who dislike eating potato chips, n(E) = 364 – 91 = 273
∴ The required probability that he/she does not like to eat potato chips = n(E)/n(S) = 273/364 = 0.75
Hence, the probability that they do not like to eat potato chips is 0.75.
Benefits Of Solving Important Questions Class 9 Mathematics Chapter 14.
The chapters and topics covered in Class 9 prepares a student for Class 10 board examinations. Class 9 students are advised to go through our question bank of Important Questions Class 9 Mathematics Chapter 14 and of other chapters. The list of important questions can make this subject easy to understand as the answers are written in an easy to understand manner and give step by step explanations to the students.
Below are some benefits of frequently solving questions from reference materials such as Important Questions Class 9 Mathematics Chapter 14:
- All questions are carefully chosen from question sources such as NCERT textbook and exemplar, CBSE past years’ questions, other reference books, etc. And our solutions are prepared based on the latest CBSE syllabus, so students can confidently rely on our solutions.
- The questions covered in our collection of Mathematics Class 9 Chapter 14 Important Questions are entirely based on all the different topics covered in the chapter Statistics. So while solving the questions students will get to revise the complete chapter..
- By solving all the questions from our question bank of Important Questions Class 9 Mathematics Chapter 14, students will get an idea about the different format of questions that can be expected in the exams. So this practice prepares students for the actual exams.
Extramarks provides extensive learning solutions for learners from Class 1 to Class 12. We have additional study resources on our website. Students can click on the links given below to access these resources:
Q.1 Draw a histogram for the following distribution:
| Marks obtained | 0-10 | 10-20 | 20-30 | 30-40 | 40-50 | 50-60 | 60-70 | 70-80 |
| No. of Students | 7 | 10 | 6 | 8 | 12 | 3 | 2 | 2 |
Marks:4
Ans
Steps to draw the histogram:
1. Represent the marks obtained on the horizontal axis on a suitable scale. Choose the scale
as 1 cm = 10 marks
2. Represent the number of students (frequency) on the vertical axis on a suitable scale.
3. Draw rectangles of width equal to the class size and lengths according to the frequencies of the corresponding class intervals.
4. Draw the rectangle for the class interval 0-10 will be of width 1 unit and length 7 units.
5. Similarly, draw the rectangles for other class intervals according to their frequencies.
The required histogram is as shown below:

Q.2 The median of the below data arranged in ascending order is 22. Find x.
8, 11, 13, 15, x+1, x+3, 30, 35, 40, 43
Marks:3
Ans
Q.3 Mean of 18 numbers is 57. If 9 is added to each number, find the new mean.
Marks:3
Ans
Q.4 If the mean of the following data is 20.2, find the value of p.
| x | 10 | 15 | 20 | 25 | 30 |
| f | 6 | 8 | p | 10 | 6 |
Marks:4
Ans
| x | f | fx |
| 10
15 20 25 30 |
6
8 P 10 6 |
60
120 20p 250 180 |
| 30+p | 610+20p |
Q.5 Find the mode of the following data :
| Marks | Number of students |
| 48 | 4 |
| 49 | 10 |
| 50 | 12 |
| 51 | 10 |
| 52 | 10 |
How many students are there whose marks are less than the modal value?
Marks:2
Ans
Since 50 marks has the highest frequency in the table.
Therefore, the mode of the data = 50.
14 students have less marks than the modal value.
FAQs (Frequently Asked Questions)
The three main types of descriptive statistics concern the frequency distribution, central tendency, and variable of a dataset
Mathematics is a subject which requires a ton of practice. To get good marks in Mathematics, one must always have a powerful conceptual knowledge of the chapter, be excellent at calculations, practice questions on a regular basis, attempt mock tests from time to time, get feedback and avoid silly mistakes. Frequent practice with discipline, working diligently and conscientiously towards your objective, will guarantee a 100% in your examinations.
you can find the important study materials for Class 9 Mathematics on the Extramarks website. Our study materials cover all important topics from sources like NCERT textbooks, NCERT exemplar and other reference sources related to the CBSE curriculum. You can build your confidence and improve your scores by practising and revising from our study resources. The important questions and their solutions will help you better understand the concepts covered in the chapter.
Students can register and get access to all the resources very easily from the Extramarks website. Besides this, Extramarks also provides NCERT study material for classes 1 to 12 and CBSE-related past-year question papers.
There are 15 chapters in Class 9 Mathematics. The list is given below:
- Chapter 1- Number System
- Chapter 2 –Polynomials
- Chapter 3 – Coordinate Geometry
- Chapter 4 –Linear Equations In Two Variables
- Chapter 5 – Introduction To Euclid’s Geometry
- Chapter 6 – Lines And Angles
- Chapter 7 –Triangles
- Chapter 8 – Quadrilaterals
- Chapter 9 –Areas Of Parallelograms And Triangles
- Chapter 10 – Circles
- Chapter 11- Constructions
- Chapter 12- Heron’s Formula
- Chapter 13-Surface Area And Volumes
- Chapter 14- Statistics
- Chapter 15- Probability