NCERT Solutions for Class 8 Maths Chapter 4 Exercise 4.1
NCERT Solutions for Class 8 Maths Chapter 4 – Data Handling Ex 4.1 are given here in simple, step-by-step form. NCERT stands for National Council of Educational Research and Training, the body that makes your textbook. Data means a collection of numbers or facts gathered for some purpose. Data handling is about showing that data in a clear picture and reading useful information from it. Exercise 4.1 works with bar graphs, double bar graphs, pie charts and frequency tables.
This exercise has 5 questions. They are based on everyday situations, such as the choice of TV shows by children, the colours people like, and marks grouped into classes. You will read a graph to answer questions, decide which kind of graph suits a set of data, and group raw data into a frequency table. Every question below is solved in short steps, with the final answer in bold. Students can use this page for homework and revision, parents can use it to check the work at home, and teachers can use it in class. A free printable PDF of these solutions is also available for offline study.
NCERT Solutions for Class 8 Maths Chapter 4 Exercise 4.1
 Data Handling
 Difficult
 Data Handling
 Medium
(i) In which subject did the student score 105 marks?(Hint: for 540 marks, the central angle = 360°. So, for 105 marks, what is the central angle?)
(ii) How many more marks were obtained by the student in Mathematics than in Hindi?
(iii) Examine whether the sum of the marks obtained in Social Science and Mathematics is more than that in Science and Hindi.
(Hint: Just study the central angles)
 Data Handling
Medium
Data Handling
Medium
(a) Spinning a wheel

(b) Tossing two coins together
Data Handling
Medium
- Probability of the pointer stopping on D ?

2. Probability of getting an ace from a well shuffled deck of 52 playing cards?
3. Probability of getting a red apple. (See figure below)

Words You Need to Know
- Bar graph: a graph that shows data using bars of equal width. The height of each bar shows the value.
- Double bar graph: two bars side by side for each item, useful for comparing two sets of data.
- Pie chart (circle graph): a circle divided into slices, where each slice shows a part of the whole.
- Frequency: how many times a value or a group of values appears in the data.
- Class interval: a group such as 0–10 or 10–20 used when the data is spread over a wide range. The size of the interval is called the class width.
- Grouped frequency table: a table that shows how many data values fall into each class interval.
Exercise 4.1 – Questions and Answers
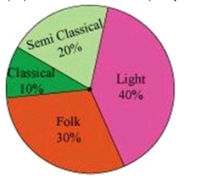
Q1. A survey was made to find the type of music that a certain group of young people liked in a city. The adjoining pie chart shows the findings of this survey.
From this pie chart answer the following:
(i) If 20 people liked classical music, how many young people were surveyed?
(ii) Which type of music is liked by the maximum number of people?
(iii) If a cassette company were to make 1000 CDs, how many of each type would they make?
Answer:
(i) From the given pie chart, the number of people who like classical music = 10%
Let the number of young people who were surveyed be 'x'.
According to the question, we get
10% of x = 20
(10/100) × x = 20
⇒ x = (20 × 100)/10
⇒ x = 200
Therefore, 200 young people were surveyed.
(ii) From the given pie chart, it can be observed that light music is liked by the maximum number of people (40%).
(iii)
Number of CDs for light music = 40%
= (40/100) × 1000 = 400
Number of CDs for folk music = 30%
= (30/100) × 1000 = 300
Number of CDs for classical music = 10%
= (10/100) × 1000 = 100
Number of CDs for semi-classical music = 20%
= (20/100) × 1000 = 200
Check: 400 + 300 + 100 + 200 = 1000 ✔
So the company would make 400 light, 300 folk, 200 semi-classical and 100 classical music CDs.
Q2. A group of 360 people were asked to vote for their favourite season from the three seasons rainy, winter and summer.
(i) Which season got the most votes?
(ii) Find the central angle of each sector.
(iii) Draw a pie chart to show this information.
| Season | No. of votes |
|---|---|
| Summer | 90 |
| Rainy | 120 |
| Winter | 150 |
Answer:
(i) Winter season got the maximum votes (150 votes).
(ii) Here, the total number of votes = 90 + 120 + 150 = 360.
The central angles of each sector are shown in the following table:
| Season | No. of votes | In fraction | Central angle |
|---|---|---|---|
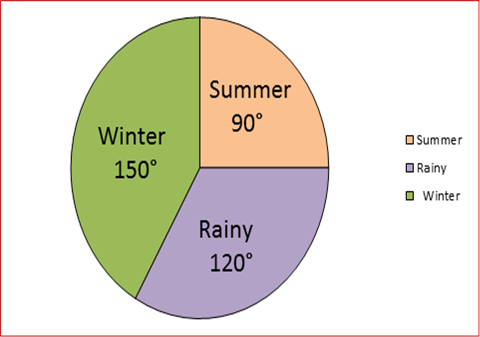
| Summer | 90 | 90/360 = 1/4 | (1/4) × 360° = 90° |
| Rainy | 120 | 120/360 = 1/3 | (1/3) × 360° = 120° |
| Winter | 150 | 150/360 = 5/12 | (5/12) × 360° = 150° |
Check: 90° + 120° + 150° = 360° ✔
(iii) The pie chart is as follows:
Q3. Draw a pie chart showing the following information. The table shows the colours preferred by a group of people.
| Colours | Number of People |
|---|---|
| Blue | 18 |
| Green | 9 |
| Red | 6 |
| Yellow | 3 |
| Total | 36 |
Answer:
The central angles for a pie chart are calculated in the following table:
| Colours | Number of people | In fraction | Central angle |
|---|---|---|---|
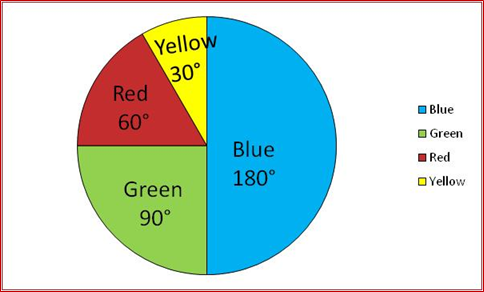
| Blue | 18 | 18/36 = 1/2 | (1/2) × 360° = 180° |
| Green | 9 | 9/36 = 1/4 | (1/4) × 360° = 90° |
| Red | 6 | 6/36 = 1/6 | (1/6) × 360° = 60° |
| Yellow | 3 | 3/36 = 1/12 | (1/12) × 360° = 30° |
| Total | 36 | 1 | 360° |
The pie chart is as follows:
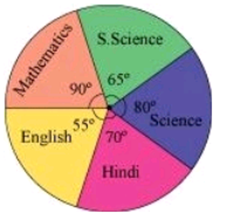
Q4. The adjoining pie chart gives the marks scored in an examination by a student in Hindi, English, Mathematics, Social Science and Science. If the total marks obtained by the students were 540, answer the following questions.
(i) In which subject did the student score 105 marks? (Hint: for 540 marks, the central angle = 360°. So, for 105 marks, what is the central angle?)
(ii) How many more marks were obtained by the student in Mathematics than in Hindi?
(iii) Examine whether the sum of the marks obtained in Social Science and Mathematics is more than that in Science and Hindi. (Hint: Just study the central angles)
Answer:
(i) Total marks obtained by the student are 540.
Hence, 540 marks represent 360°.
Now, we have to find the central angle for 105 marks.
= (105/540) × 360°
= 70°
Therefore, the subject in which the student scored 105 marks is Hindi, because the central angle for Hindi is 70°.
(ii) The central angle for Mathematics is 90°.
Marks obtained by the student in Mathematics
= (90°/360°) × 540
= 135
The central angle for Hindi is 70°, so the marks obtained by the student in Hindi
= (70°/360°) × 540
= 105
Therefore, the difference between the marks of Mathematics and Hindi = 135 − 105 = 30.
Hence, 30 more marks were obtained by the student in Mathematics than in Hindi.
(iii) The sum of the central angles of Social Science and Mathematics
= 65° + 90°
= 155°
However, the sum of the central angles of Science and Hindi
= 80° + 70°
= 150°
We can observe that the sum of the central angles for Social Science and Mathematics is more than that of Science and Hindi.
Therefore, the student scored more in Social Science and Mathematics than in Science and Hindi.
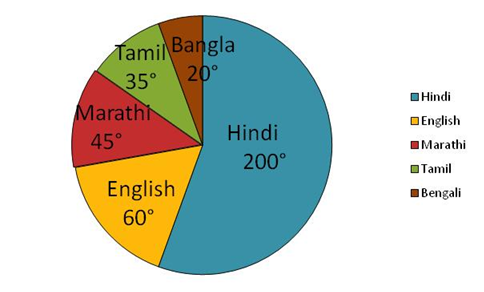
Q5. The number of students in a hostel, speaking different languages is given below. Display the data in a pie chart.
| Language | Hindi | English | Marathi | Tamil | Bengali | Total |
|---|---|---|---|---|---|---|
| Number of Students | 40 | 12 | 9 | 7 | 4 | 72 |
Answer:
The central angle for each language is as follows:
| Language | Number of students | In fraction | Central angle |
|---|---|---|---|
| Hindi | 40 | 40/72 = 5/9 | (5/9) × 360° = 200° |
| English | 12 | 12/72 = 1/6 | (1/6) × 360° = 60° |
| Marathi | 9 | 9/72 = 1/8 | (1/8) × 360° = 45° |
| Tamil | 7 | 7/72 | (7/72) × 360° = 35° |
| Bengali | 4 | 4/72 = 1/18 | (1/18) × 360° = 20° |
| Total | 72 | 1 | 360° |
Check: 200° + 60° + 45° + 35° + 20° = 360° ✔
The pie chart is as follows:
Related Links
Q.1 Construct the following quadrilaterals.
| (i) Quadrilateral ABCD | (ii) Quadrilateral JUMP |
| AB = 4.5 cm | JU = 3.5 cm |
| BC = 5.5 cm | UM = 4 cm |
| CD = 4 cm | MP = 5 cm |
| AD = 6 cm | PJ = 4.5 cm |
| AC = 7 cm | PU = 6.5 cm |
| (iii) Parallelogram MORE | (iv) Rhombus BEST |
| OR = 6 cm | BE = 4.5 cm |
| RE = 4.5 cm | ET = 6 cm |
| EO = 7.5 cm |
Ans

Steps of construction:
- Draw a line segment BC of length 5.5 cm.
- With B as centre, draw an arc of radius 4.5 cm.
- With C as centre, draw an arc of radius 7 cm intersecting the previous arc at point A.
- Join AB and AC.
- With C as centre, draw an arc of radius 4 cm at point D.
- With A as centre, draw an arc of radius 6 cm cuting the previous arc at D.
- Join AD and CD.
Therefore, ABCD is the required quadrilateral.
(ii)

Steps of construction:
- Draw a line segment PU of length 6.5 cm.
- With P as centre, draw an arc of radius 4.5 cm.
- With U as centre, draw an arc of radius 3.5 cm intersecting the previous arc at point J.
- Join PJ and JU.
- With P as centre, draw an arc of radius 5 cm at point M.
- With U as centre, draw an arc of radius 4 cm intersecting the previous arc at M.
- Join PM and MU.
Therefore, JUMP is the required quadrilateral.
(iii)

Steps of construction:
- Draw a line segment OR of length 6 cm.
- With O as centre, draw an arc of radius 7.5 cm.
- With R as centre, draw an arc of radius 4.5 cm intersecting the previous arc at point E.
- Join OE and RE.
- With O as centre, draw an arc of radius 4.5 cm at point M.
- With E as centre, draw an arc of radius 6 cm intersecting the previous arc at M.
- Join OM and EM.
Therefore, MORE is the required parallelogram.
(iv)

Steps of construction:
- Draw a line segment ET of length 6 cm.
- With E as centre, draw an arc of radius 4.5 cm.
- With T as centre, draw an arc of radius 4.5 cm intersecting the previous arc at point B.
- Join BE and BT.
- With E as centre, draw an arc of radius 4.5 cm at point S.
- With T as centre, draw an arc of radius 4.5 cm intersecting the previous arc at S.
- Join ES and TS.
Therefore, BEST is the required rhombus.