Important Questions for CBSE Class 8 Maths Chapter 15 – Introduction to Graphs
Important Questions Class 8 Maths Chapter 15 - Introduction to Graphs
Maths is a fascinating subject which requires proper analytical and logical skills to solve any problem. To be adept in Maths, one must practise solving many problems. It helps one to enhance their abilities in interpreting problems and develop a good grip on the subject.
Chapter 15 of Class 8 Maths is about ‘Introduction To Graph’. Following are the important topics that the chapter covers:
- Introduction to Graphs
- A Bar Graph
- A Pie Graph or A Circle Graph
- A Histogram
- A Line Graphs
- Location of a Point
- Coordinates
- Some Applications
Extramarks is a secure and well-rounded educational platform that gives students access to all NCERT-related study materials such as NCERT solutions, CBSE revision notes, topic-related formulas, CBSE past years’ question papers, etc.
Out-and-out practice in deciphering queries related to the topic is the only way to gain versatility in Maths. Extramarks is one of the best and most renowned online educational platforms that helps students in their Class 1 to Class 12 to prepare in all possible ways. Extramarks understands the importance of practising problems when we talk about getting a good hold on Maths.
After rigorous research and analysis of past years’ question papers and NCERT textbooks, our highly qualified and well-experienced faculty members have prepared a list of essential questions in our question bank Important Questions Class 8 Maths Chapter 15. This set of important questions and solutions will help students to clear concepts associated with the chapter Introduction to Graphs. Our experts have given step-by-step solutions using the required formulas to solve each question.
Along with the provision of Important Questions Class 8 Maths Chapter 15, Extramarks also gives students access to CBSE revision notes, CBSE sample papers, and CBSE past year question papers. All these solutions strictly adhere to the latest CBSE syllabus making them the most reliable study materials available in the market today.
Get Access to CBSE Class 8 Maths Important Questions 2022-23 with Chapter-Wise Solutions
You can also find CBSE Class 8 Maths Chapter-by-Chapter Important Questions here:
| CBSE Class 8 Maths Important Questions | ||
| Sr No. | Chapters | Chapters Name |
| 1 | Chapter 1 | Rational Numbers |
| 2 | Chapter 2 | Linear Equations in One Variable |
| 3 | Chapter 3 | Understanding Quadrilaterals |
| 4 | Chapter 4 | Practical Geometry |
| 5 | Chapter 5 | Data Handling |
| 6 | Chapter 6 | Squares and Square Roots |
| 7 | Chapter 7 | Cubes and Cube Roots |
| 8 | Chapter 8 | Comparing Quantities |
| 9 | Chapter 9 | Algebraic Expressions and Identities |
| 10 | Chapter 10 | Visualising Solid Shapes |
| 11 | Chapter 11 | Mensuration |
| 12 | Chapter 12 | Exponents and Powers |
| 13 | Chapter 13 | Direct and Inverse Proportions |
| 14 | Chapter 14 | Factorisation |
| 15 | Chapter 15 | Introduction to Graphs |
| 16 | Chapter 16 | Playing with Numbers |
Introduction to Graphs Class 8 Important Questions with Solutions
Following are a few questions and their solutions included in our Class 8 Maths Chapter 15 Important Questions. Students may register on our website to get full access to our question bank and its solutions.
Question 1: Use the tables below to draw linear graphs:
(a) The number of days a hillside city received snow in different years.
| Years | 2003 | 2004 | 2005 | 2006 |
| Days | 8 | 10 | 5 | 12 |
(b) Population (in thousands) of men and women in a village in different years.
| Years | 2003 | 2004 | 2005 | 2006 | 2007 |
| No. of men | 12 | 12.5 | 13 | 13.2 | 13.5 |
| No. of women | 11.3 | 11.9 | 13 | 13.6 | 12.8 |
Answer 1: (a) Let us take ‘Years’ along the x-axis and ‘Days’ along the y-axis. Hence, using the data provided by the table, the linear graph that we get is:

(b) Let us take Years along the x-axis and No. of Men and 'No of Women' along the y-axis. Hence, using the data provided by the table, the linear graph that we get is:

Question 2: Plot the following points on a graph sheet. Verify if they lie in a line:
(a) A(4,0), B(4,2), C(4,6), D(4,2.5).
(b) P(1,1), Q(2,2), R(3,3), S(4,4).
(c) K(2,3), L(5,3), M(5,5), N(2,5).
Answer 1: First we plot all the points in a graph:
(a)

Hence, we find out that points A, B, C and D lie in the same line.
(b)

Hence, we find out that the points P, Q, R and S also lie in the same line.
(c)

Hence, we find out that points K, L, M and N do not lie in the same line.
Question 3: The following line graph shows the yearly sales figure for a manufacturing company:
(a) What were the sales in (i) 2002 (ii) 2006?
(b) What were the sales in (i) 2003 (ii) 2005?
(c) Compute the difference between the sales in 2002 and 2006.
(d) In which year was there the greatest difference between the sales as compared to the previous year?
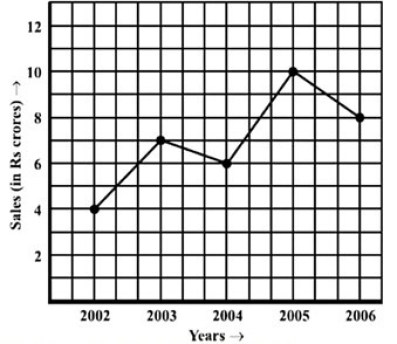
Answer 3: (a) (i) Sales in 2002 = Rs. 4 crore.
(ii) Sales in 2006 = Rs. 8 crore.
(b) (i) Sales in 2003 = Rs. 7 crore.
(ii) Sales in 2005 = Rs. 10 crore
(c) Hence, difference between the sales in 2002 and 2006 = Rs. (8 - 4) crore
(d) Difference between sales in 2006 and 2005 = Rs. (10 - 8) crore = Rs. 2 crore.
Difference between sales in 2005 and 2004 = Rs. (10 - 6) crore = Rs. 4 crore.
Difference between sales in 2004 and 2003 = Rs. (7 - 6) crore = Rs. 1 crore.
Difference between sales in 2003 and 2002 = Rs. (7 - 4) crore = Rs. 3 crore.
Therefore, the maximum sale was in the year 2005 compared to that of 2004.
Question 4: Can there be a time-temperature graph as follows? Justify your answer.


Answer 4: We cannot have different temperatures at the same time.
- This can be a time-temperature graph, since the temperature increases with the increase in time.
- This can be a time-temperature graph since the temperature decreases with the decrease in time.
- This cannot be a time-temperature graph since different temperatures at the same time are not possible.
- This can be a time-temperature graph since the same temperature at different times is possible.
Question 5: Draw a graph for the following:
(i)
| Side of square (in cm) | 2 | 3 | 3.5 | 5 | 6 |
| Perimeter (in cm) | 8 | 12 | 14 | 20 | 24 |
Is it a linear graph?
(ii)
| Side of square ( in cm) | 2 | 3 | 4 | 5 | 6 |
| Area ( in cm²) | 4 | 9 | 16 | 25 | 36 |
Is it a linear graph?
Answer 5: (i) First we plot the graph by taking Side of Square along x-axis and Perimeter along y-axis

Therefore, It is a linear graph.
(ii) First, we plot the graph by taking the Side of the Square along the x-axis and the Area along the y-axis.

Question 6:
The cost of a notebook is Rs.10. Draw a graph after making a table showing the cost of 2,3, 4 …Notebooks. Use it to find
(a) The cost of 7 notebooks
(b) The number of notebooks purchased with Rs 50.
Answer 6: Plotting the graph, we get

(a) Now following the graph we can find that
Cost of 7 notebooks = Rs. 70
(b) Now following the graph we can find that,
No. of notebooks purchased with Rs. 50 = 5
Question 7: Explain the situations represented by the following distance-time graphs.

Answer 7: (a) The graph represents that the object has travelled an equal distance in an equal intervals of time, i.e., the object moves with uniform velocity.
(b) The graph represents that the object moves with uniform velocity for some time and then becomes constant.
(c ) The distance covered by the object reduces gradually, i.e., the body moves with decreasing velocity.
Question 8:
Draw a graph for the radius and circumference of the circle using a suitable scale.
From graph
(a) Find the circumference of the circle when the radius is 42 units.
(b) At what radius will the circumference of the circle be 220 units?
Answer 8: Since we know that,
Circumference of a circle = 2πr = 2 × 22/7 × r = 44r/7
Let us take the radius = 7 units
Therefore, the circumference = 2 × π × r = 44 × 7/7 = 44 units.
Now let us take the radius = 14 units
Therefore, the circumference = 2 × π × r = 44 × 14/7 = 88 units
After we calculate so on, we get the following table. And the graph is plotted as shown below:

| Radius of the circle | 7 | 14 | 21 | 28 | 35 | 42 |
| Circumference of the circle | 44 | 88 | 132 | 176 | 220 | 264 |
Hence, from the graph we find that
(a) The circumference of the circle on taking the radius as 42 units is 264 units.
(b) The circle's radius will be 35 units taking the circumference as 220 units.
Question 9: Plot the given points on a graph sheet and check if the points lie in a straight line. If not, name the shape they form when joined in the given order.
(a) (1, 2), (2,4), (3,6), (4,8).
(b) (1,1), (1,2), (2,1), (2,2).
(c) (4,2), (2,4), (3,3), (5,4).
Answer 9: (a) First, we plot the points on the graph as shown below:

Hence, from the graph we find that the points are on a straight line.
(b) First, we plot the points on the graph as shown below:

Hence, from the graph, we find that the points are not in a straight line. The points are in the form of a square.
(c ) First, we plot the points on the graph as shown below:

Hence, from the graph, we find that the points are not in a straight line. The points are forming a triangle.
Benefits of solving Class 8 maths Chapter 15 Extra Questions
Practice is the prerequisite for being adept in Maths. It helps the student to develop a firm conception of the subject. Practising the Important Questions Class 8 Maths Chapter 15 provided by Extramarks, students are well prepared and proficient to solve any complex problem during examinations.
Following are some benefits of solving the introduction to graphs class 8 important questions:
- Introduction to Graphs Class 8 Extra Questions is a compilation of some well-picked questions by our experts. Our qualified academicians have prepared these questions after considering and analysing all the past years’ papers and CBSE textbooks.
- All the questions and answers strictly abide by the CBSE syllabus and follow the CBSE guideline so that the students have complete faith in them. Extramarks important questions, revision notes, sample papers etc. to develop their maths abilities and make them confident during exams.
- All the Chapter 15 Class 8 Maths Important Questions have been solved with proper usage of formulas and adequate explanation so that the students do not have trouble understanding the problems and their solutions.
At Extramarks, we understand the importance of solving important questions and we take our role seriously to provide the best resource to the students and help them excel in life. To speed up their learning and improve their academic performance, students must register themselves now, to begin their preparation without any further delay. The learning website of Extramarks provides study materials other than Important Questions Class 8 Maths Chapter 15 as well, like:
- NCERT books
- CBSE revision notes
- CBSE sample papers
- Important Formulas
- CBSE extra questions
Q.1 Draw the line passing through (2, 3) and (3, 2). Find the coordinates of the points at which this line meets the x-axis and y-axis.
Marks:2
Ans

(2, 3) and (3, 2) meets the x-axis at (5, 0) and y-axis at (0, 5) .
Q.2
Plot the following points. Verify if they lie on a line.
(1, 3), (2, 3), (3, 3), (4, 3)
Marks:2
Ans

Yes, they all lie on a line.
Q.3
Draw a graph for the following.
| Distance in metres |
5 | 10 | 15 | 20 | 25 | 30 |
| Time in seconds | 1 | 2 | 3 | 4 | 5 | 6 |
Is it a linear graph?
Marks:2
Ans

Yes, it is a linear graph.
Q.4
In which year was there the greatest difference between the sales as compared to its previous year?

Marks:3
Ans

In year 2004, sales is 6 million
In year 2005, sales is 12 million
Difference is 6 million. It’s the greatest difference between the sales as compared to its previous year.
Q.5
Find the coordinates of the points A, B, C, D, E and F from the graph.

Marks:2
Ans
A (-4, 0), B (-2, 3), C (1, 3), D (3, 1), E (1, -1), F(-2, -1)
CBSE Class 8 Maths Important Questions
FAQs (Frequently Asked Questions)
A graph is a mathematical tool that lets us visualise the numerical data provided to us. Representing the entire data in a graphical format makes it easier for us to understand it clearly. The usage of a graph is easy. First, choose a scale along the x-axis and the y-axis, then plot the point by taking the coordinates. The solutions provided by Extramarks in Important Questions Class 8 Maths Chapter 15 have shown the proper and easy usage of graphs for the students to enjoy a better learning experience and enhance their performance in the examination.
Students can have a good grasp of Maths only through the regular and thorough practice of solving as many types of complex problems as possible. The most trusted and reliable source Extramarks gives students access to various exam-oriented questions provided as Important Questions Class 8 Maths Chapter 15. Extramarks subject experts have picked all important questions after thoroughly analysing NCERT books, CBSE past years’ question papers, etc. so that the students can solve them and be well prepared for their examinations